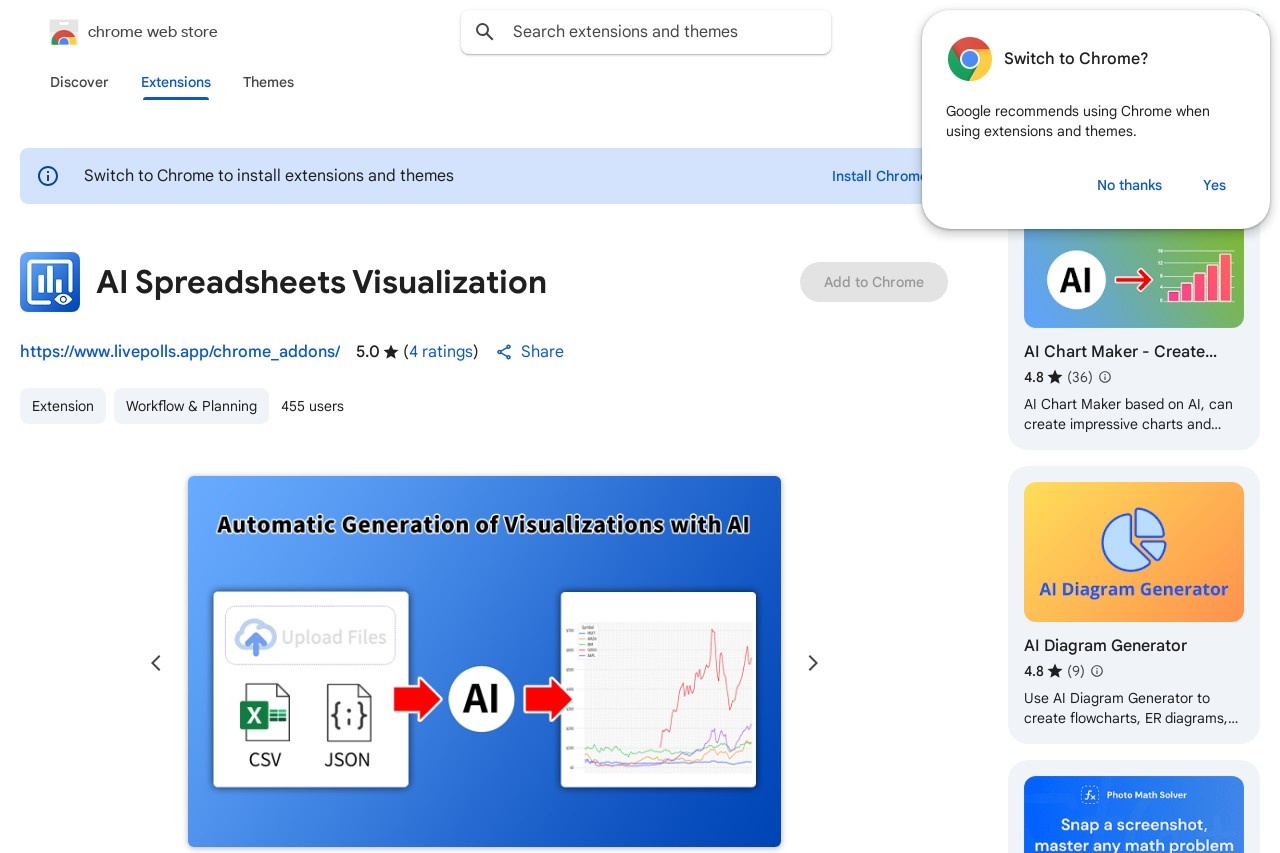
Automatically generate data visualizations from spreadsheets using AI.
AI Spreadsheets Visualization
AI Spreadsheets Visualization
In today's data-driven world, spreadsheets remain a cornerstone for organizing and analyzing information. However, transforming raw data into meaningful insights often requires time-consuming manual work. This is where AI-powered spreadsheet visualization comes into play.
How AI Transforms Data Visualization
Modern AI solutions can automatically:
- Detect patterns and trends in spreadsheet data
- Recommend the most appropriate chart types
- Generate interactive visualizations with one click
- Adapt visualizations as data changes
Key Benefits for Users
AI-powered visualization tools offer significant advantages:
- Time savings: Reduce hours of manual chart creation to seconds
- Improved accuracy: Minimize human errors in data representation
- Enhanced insights: Discover hidden patterns through AI analysis
- Accessibility: Make data understandable for non-technical users
Common Use Cases
Organizations across industries are leveraging this technology for:
- Financial reporting and analysis
- Sales performance tracking
- Marketing campaign measurement
- Operational metrics monitoring
Getting Started with AI Visualization
Most modern spreadsheet applications now incorporate some level of AI capabilities. To begin:
- Ensure your data is properly formatted
- Select the AI visualization tool in your spreadsheet software
- Review the automatically generated suggestions
- Customize the output as needed
As AI continues to evolve, we can expect even more sophisticated visualization capabilities that will further democratize data analysis and empower users at all skill levels.