An AI-powered tool that automates data visualization and analysis, enabling quick generation of precise graphs without coding.
Sheetbot
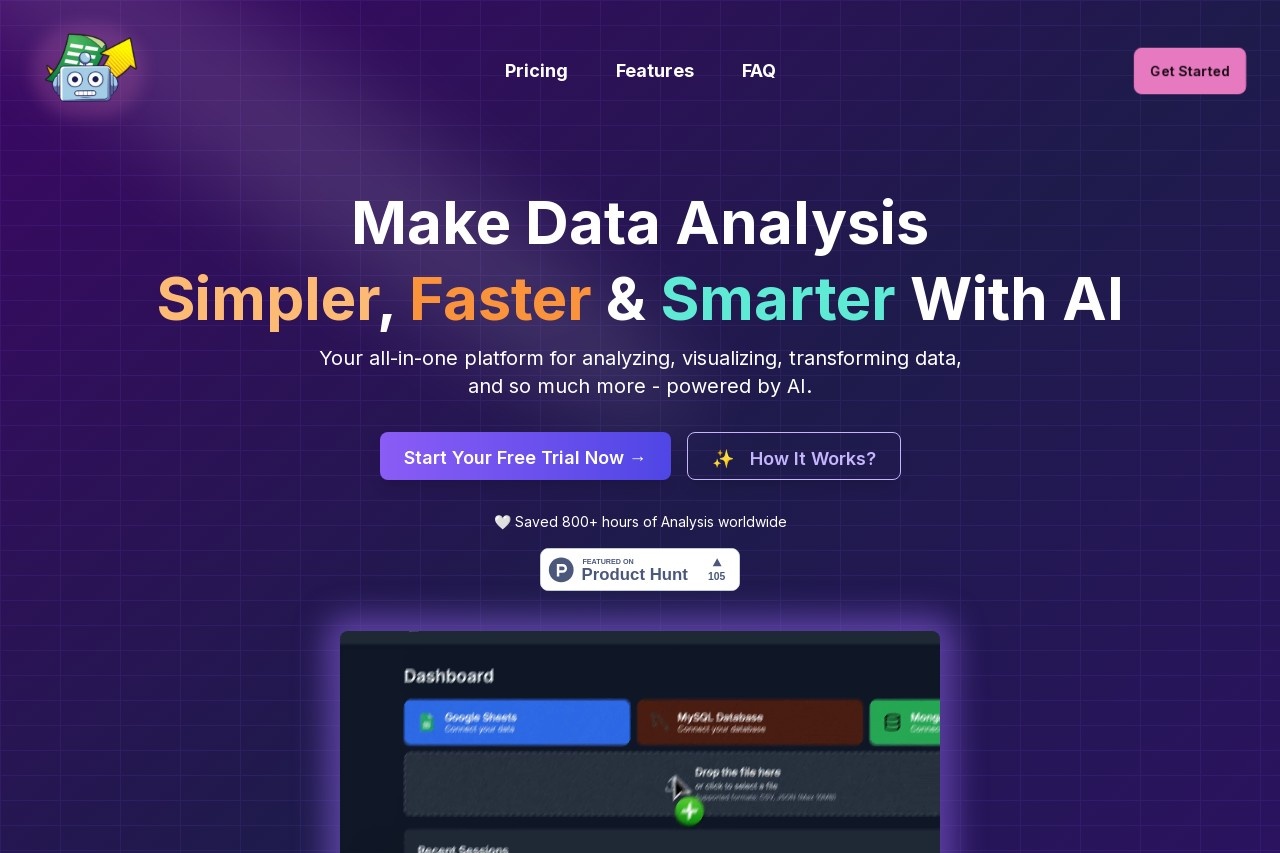
Sheetbot: AI-Powered Data Visualization Made Simple
In today's data-driven world, transforming raw numbers into actionable insights is crucial for decision-making. Sheetbot emerges as a groundbreaking solution that bridges the gap between complex datasets and intuitive visualizations – no coding required.
What is Sheetbot?
Sheetbot is an artificial intelligence platform designed to automate data analysis and visualization. By leveraging advanced machine learning algorithms, it interprets your spreadsheet data and generates accurate, publication-ready graphs in seconds.
Key Features
- Instant Graph Generation: Convert spreadsheet data into bar charts, line graphs, or pie charts with a single click
- Smart Analysis: AI detects patterns, trends, and outliers in your dataset automatically
- Natural Language Processing: Create visualizations using simple English commands
- Multi-Platform Export: Download visuals in PNG, SVG, or directly embed in presentations
- Collaboration Tools: Share interactive dashboards with team members in real-time
Who Benefits from Sheetbot?
This versatile tool serves professionals across industries:
- Business analysts needing quick reports
- Researchers visualizing complex datasets
- Marketing teams tracking campaign performance
- Educators creating instructional materials
- Students working on data-intensive projects
How It Works
The process couldn't be simpler:
- Upload your spreadsheet or connect to cloud storage
- Select your desired visualization type or let Sheetbot recommend the most effective format
- Customize colors, labels, and formatting using intuitive controls
- Export or share your professional-quality visualization
By eliminating the technical barriers of traditional data visualization tools, Sheetbot empowers users to focus on insights rather than software mechanics. Its intelligent automation handles everything from axis scaling to optimal chart selection, ensuring your data tells its story clearly and effectively.