Hex is a platform that goes beyond traditional dashboards for data analysis.
Hex
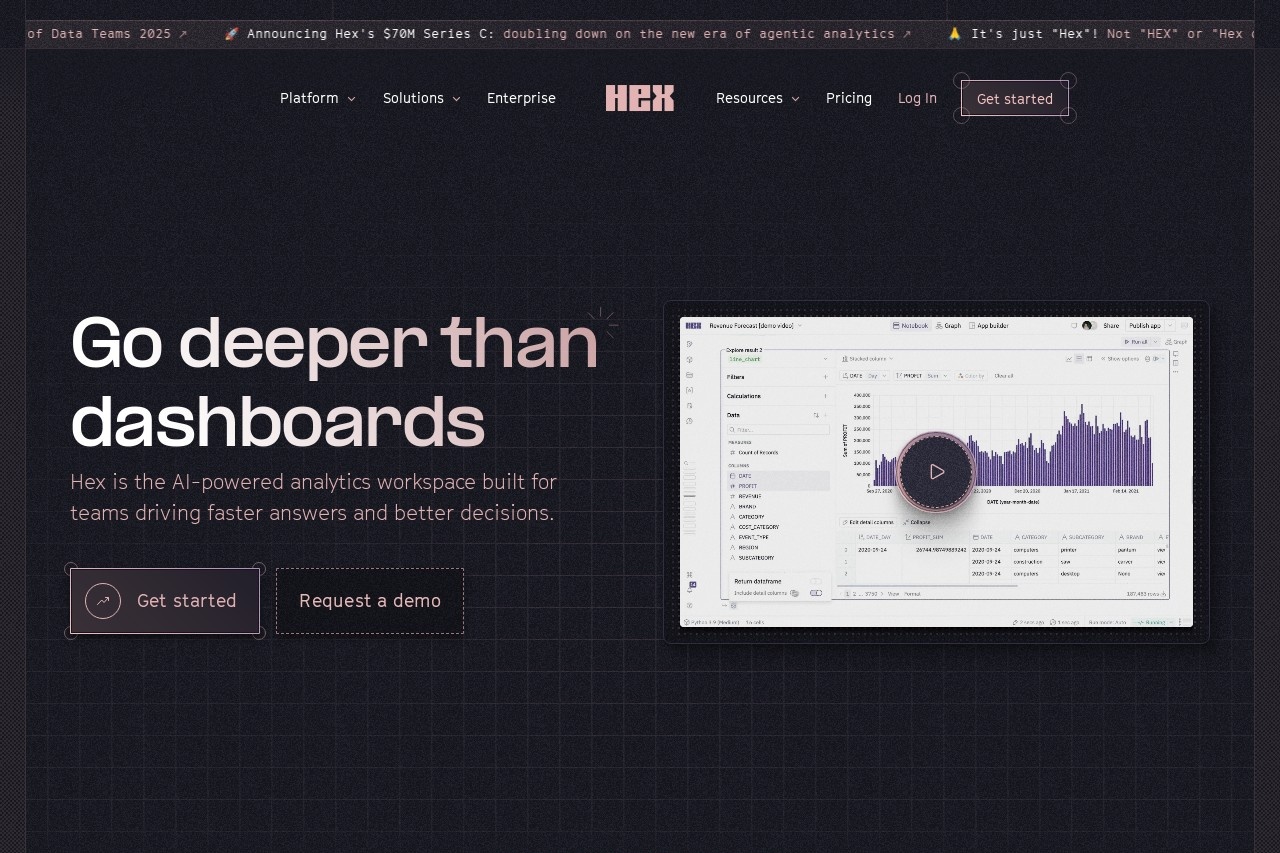
Hex: Beyond Traditional Dashboards for Data Analysis
Hex is a modern data analysis platform designed to help teams collaborate, explore, and share insights more effectively. Unlike traditional dashboards, Hex combines the flexibility of notebooks with the power of interactive applications, enabling users to go deeper into their data.
Key Features of Hex
- Interactive Notebooks: Write SQL, Python, or R code in a collaborative environment with real-time execution.
- Dynamic Visualizations: Create charts and tables that update automatically as data changes.
- Parameterized Reports: Build reusable templates where inputs (like date ranges or filters) can be adjusted without rewriting queries.
- Team Collaboration: Comment, version control, and shared workspaces streamline teamwork.
- One-Click Sharing: Publish analyses as interactive web apps or embed them in tools like Slack.
Why Hex Stands Out
Traditional dashboards often limit users to predefined views, requiring engineering support for changes. Hex bridges the gap between static reports and full-fledged data science tools by offering:
- Self-service exploration for non-technical users via no-code filters.
- Advanced capabilities for data professionals through code integration.
- Seamless connectivity to databases (Snowflake, BigQuery, etc.) and APIs.
Use Cases
Hex is versatile enough for:
- Ad-hoc analysis during business meetings
- Building internal data tools (e.g., customer segmentation apps)
- Creating client-facing reports with controlled access
- Automating recurring analyses with scheduled refreshes
By unifying exploration, visualization, and sharing, Hex helps organizations move faster from raw data to actionable decisions.