Viznotion
Viznotion: A Platform for Data Visualization and Collaboration
In today's data-driven world, the ability to visualize and collaborate on complex datasets is essential for businesses and individuals alike. Viznotion is a powerful platform designed to simplify these processes, offering intuitive tools for transforming raw data into meaningful insights.
Key Features of Viznotion
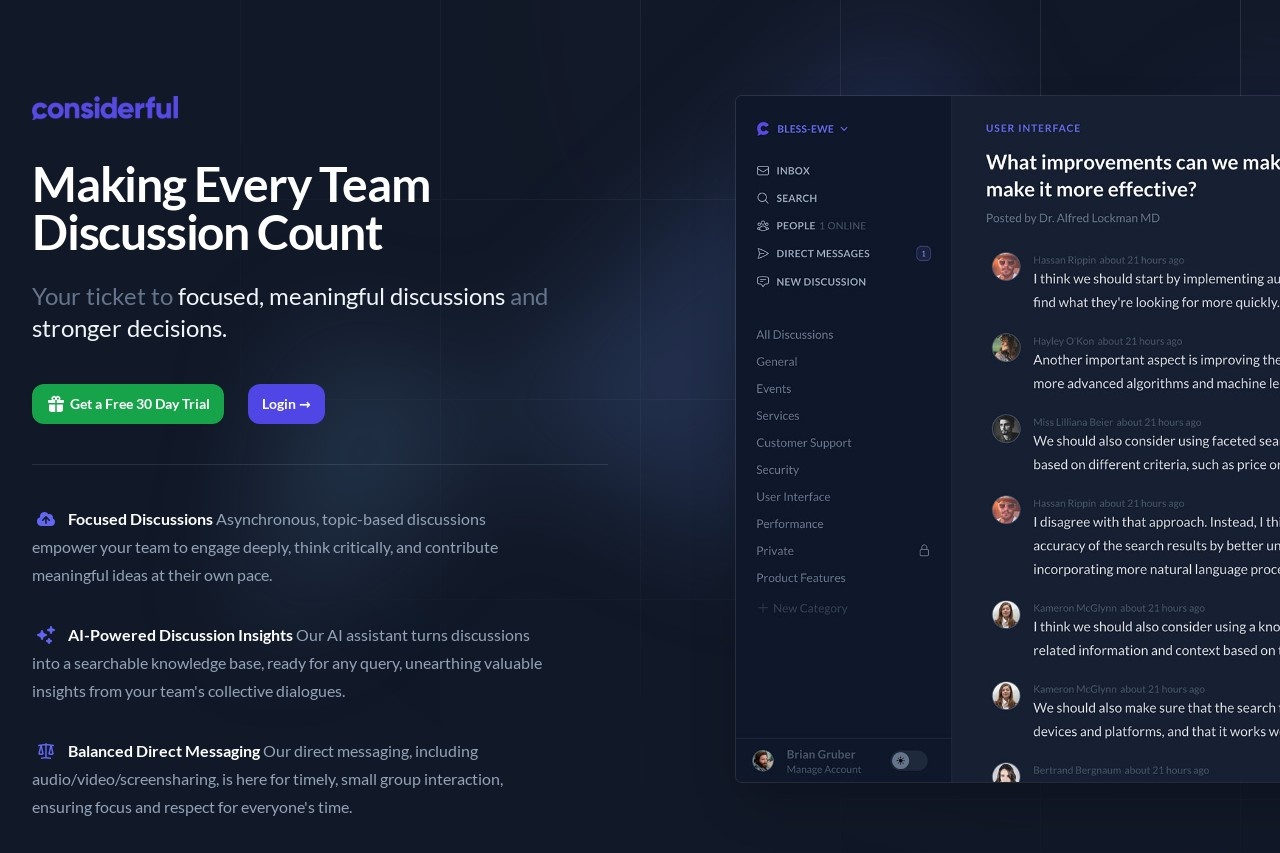
- Interactive Dashboards: Create dynamic visualizations with drag-and-drop functionality.
- Real-Time Collaboration: Share projects with team members and edit simultaneously.
- Multiple Chart Types: Choose from bar graphs, pie charts, heatmaps, and more.
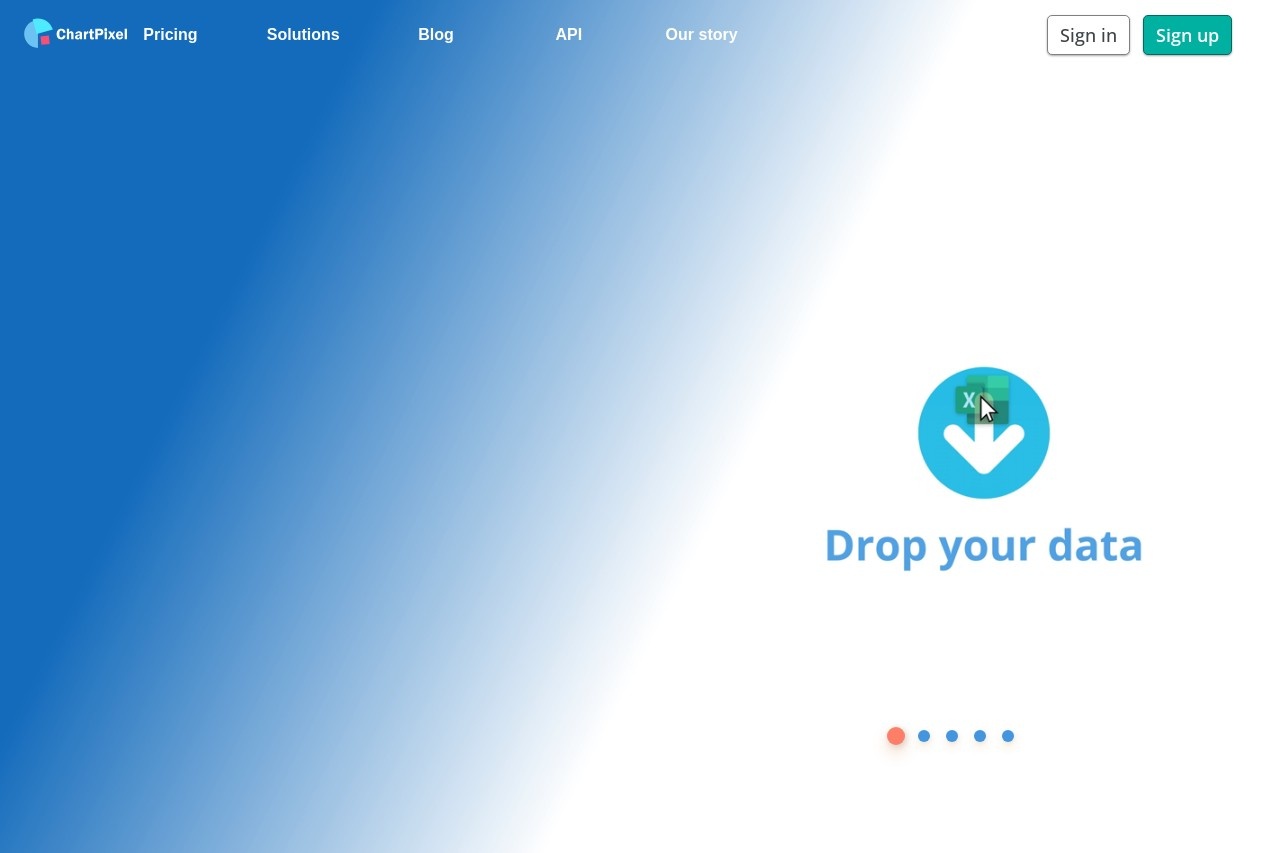
- Cloud Integration: Connect seamlessly with popular storage services like Google Drive and Dropbox.
- Custom Templates: Accelerate workflow with pre-designed templates for common use cases.
Who Can Benefit from Viznotion?
Viznotion serves a wide range of professionals:
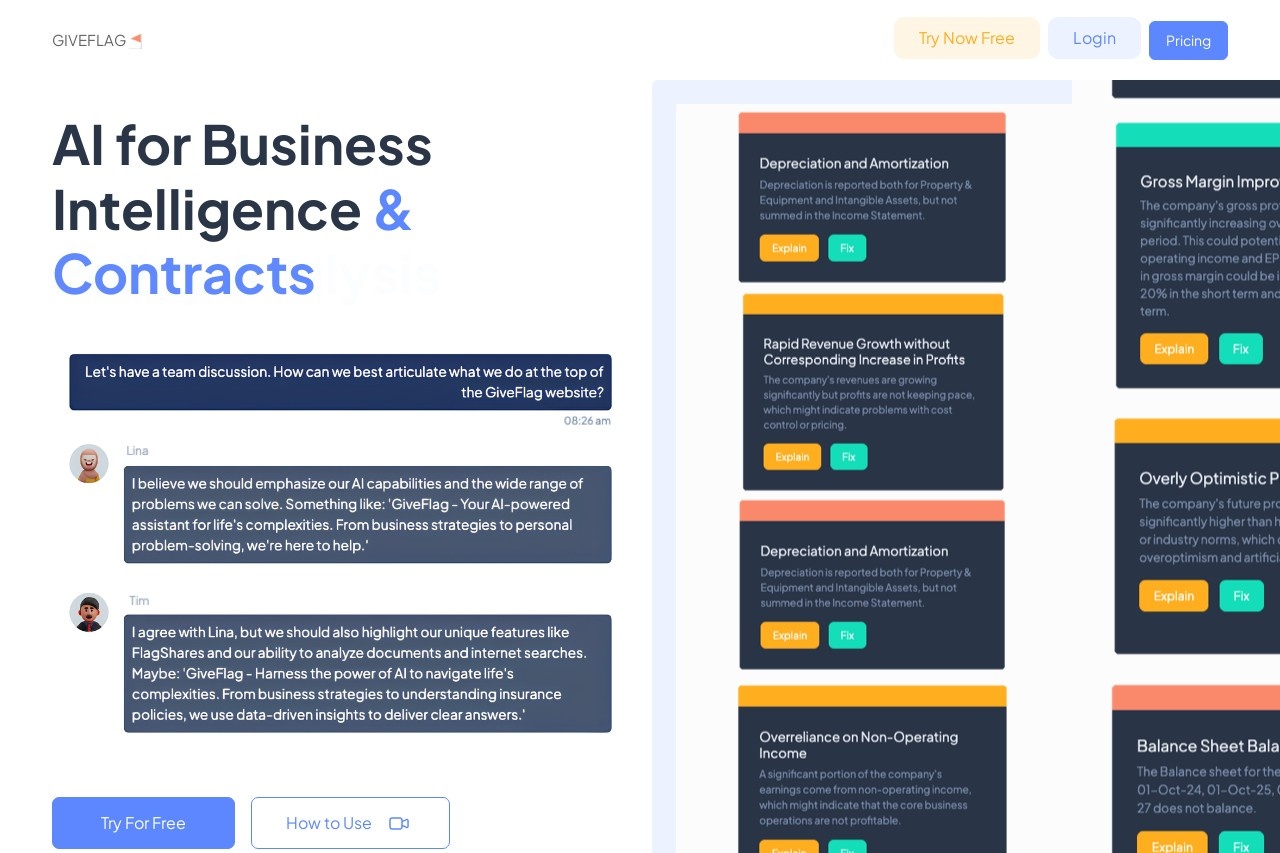
- Data analysts needing to present findings clearly
- Marketing teams tracking campaign performance
- Researchers collaborating on large datasets
- Educators creating visual learning materials
Getting Started
The platform offers a free tier with basic features, making it accessible for beginners. Advanced features like automated reporting and API access are available in premium plans. Users can import data from spreadsheets or connect directly to databases for live updates.
With its clean interface and robust functionality, Viznotion bridges the gap between complex data analysis and actionable business intelligence. Whether you're working solo or as part of a distributed team, the platform adapts to your visualization needs while maintaining data security and integrity.