ChartPixel offers AI-powered data analysis and interactive visualization for raw data or surveys.
ChartPixel
ChartPixel: AI-Powered Data Analysis Made Simple
In today's data-driven world, extracting meaningful insights from raw information is crucial for decision-making. ChartPixel revolutionizes this process by combining artificial intelligence with intuitive visualization tools, transforming complex datasets into clear, actionable intelligence.
Key Features
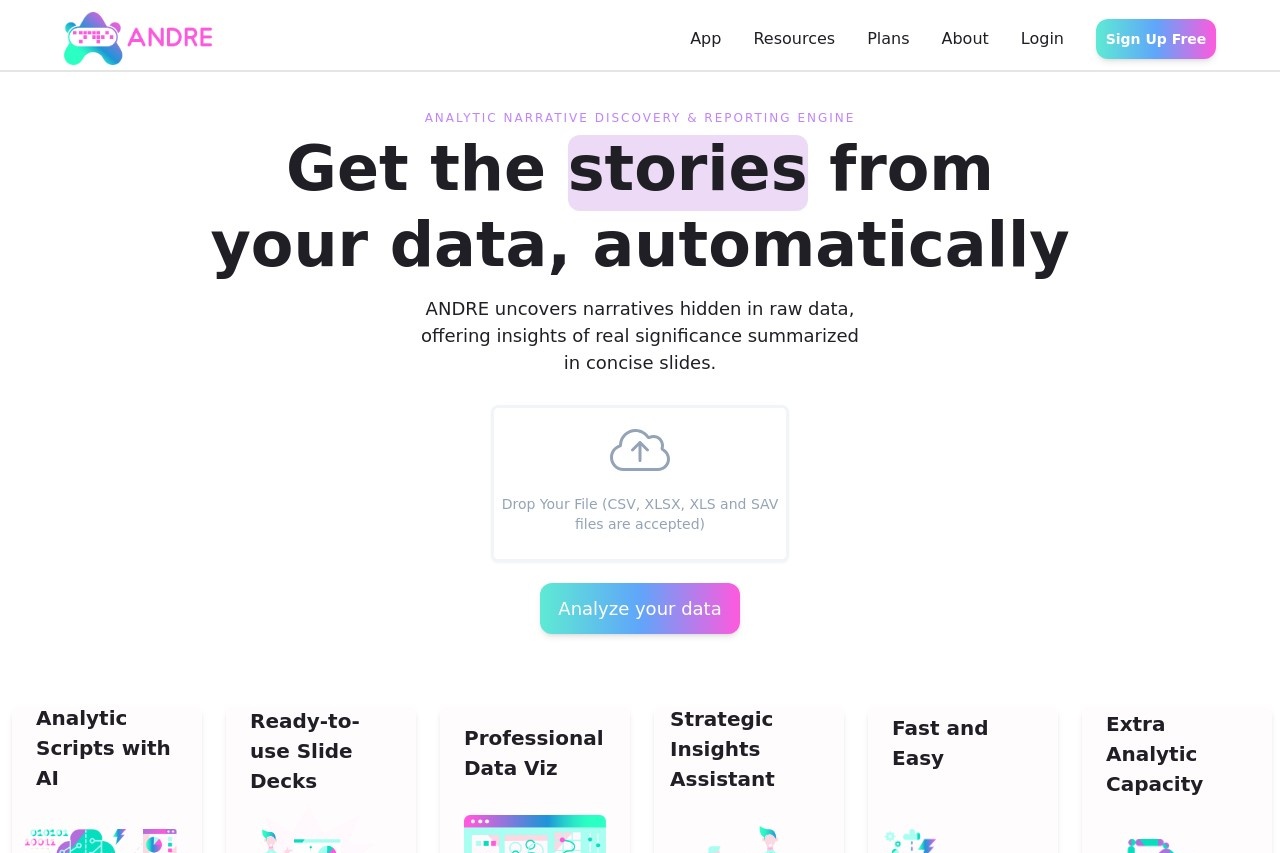
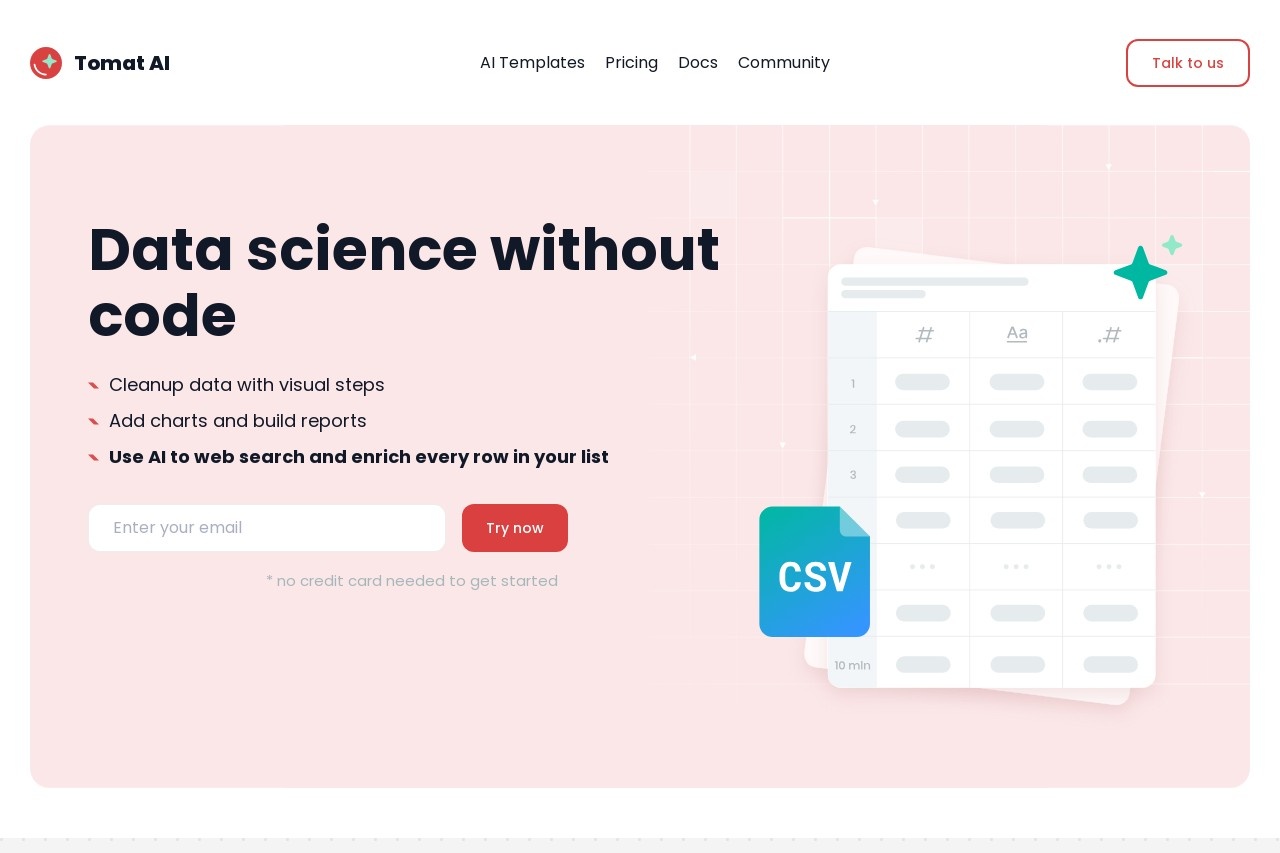
- Automated Data Processing: Upload spreadsheets or survey results and let AI handle the heavy lifting of cleaning and organizing data
- Smart Visualization: The system recommends optimal chart types based on your data structure and analysis goals
- Interactive Exploration: Drill down into specific data points or zoom out for big-picture trends with intuitive controls
- Collaboration Tools: Share dynamic reports with team members or embed visualizations in presentations
Who Benefits from ChartPixel?
This versatile platform serves diverse professionals:
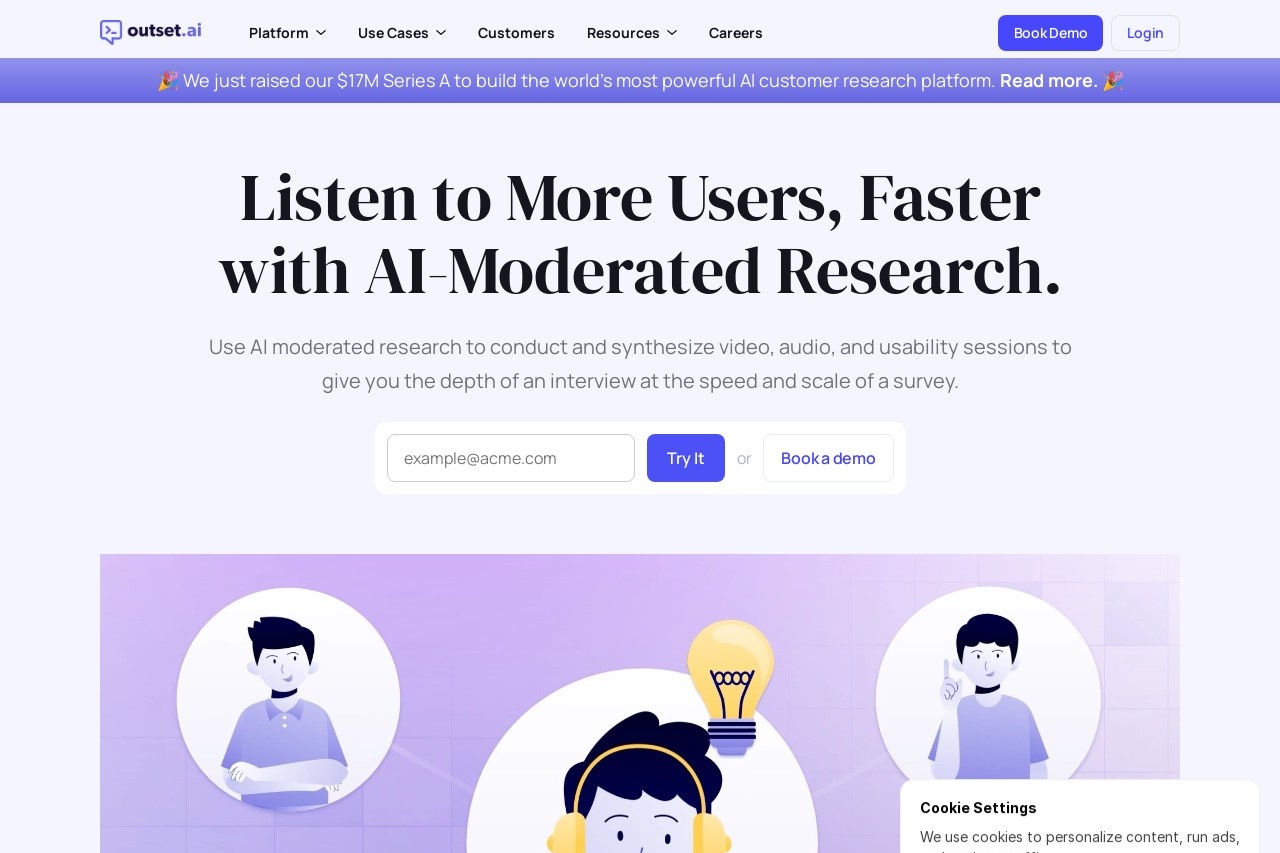
- Market researchers analyzing customer feedback
- Business analysts tracking performance metrics
- Academic researchers processing experimental data
- Journalists creating data-driven stories
The AI Advantage
ChartPixel's machine learning algorithms go beyond basic chart generation. The system identifies statistical patterns, suggests meaningful comparisons, and even flags potential anomalies in your data. This intelligent approach helps users discover insights they might otherwise miss using traditional analysis tools.
Unlike static reporting tools, ChartPixel maintains the connection to your original data. As information updates, visualizations automatically refresh - ensuring your team always works with the latest figures. The platform supports common file formats including CSV, Excel, and Google Sheets, with enterprise-level security for sensitive data.
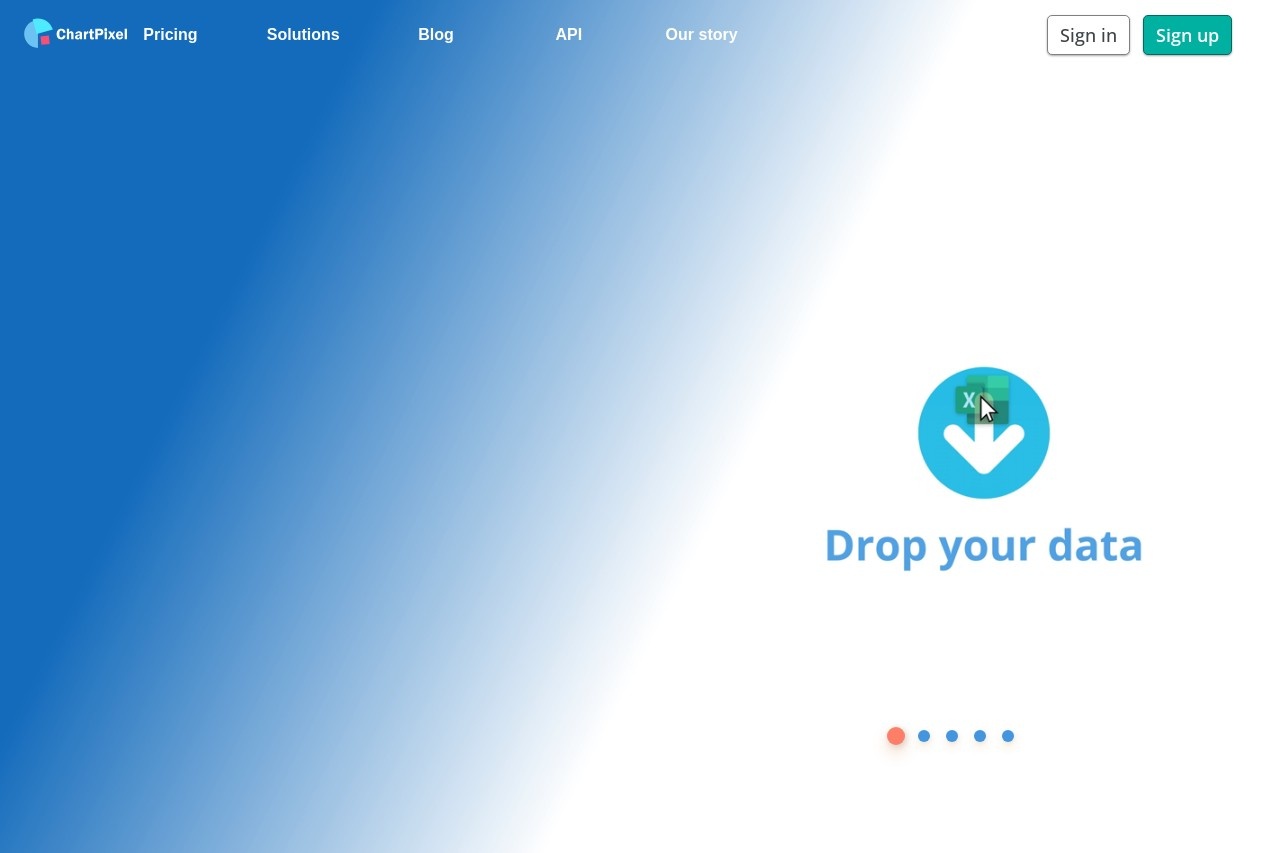
Getting Started
New users can begin analyzing data within minutes. The streamlined interface guides you through three simple steps: upload your dataset, review AI-generated insights, and customize visualizations. No coding or advanced statistics knowledge required - just drag, click, and gain understanding.